|
||
|
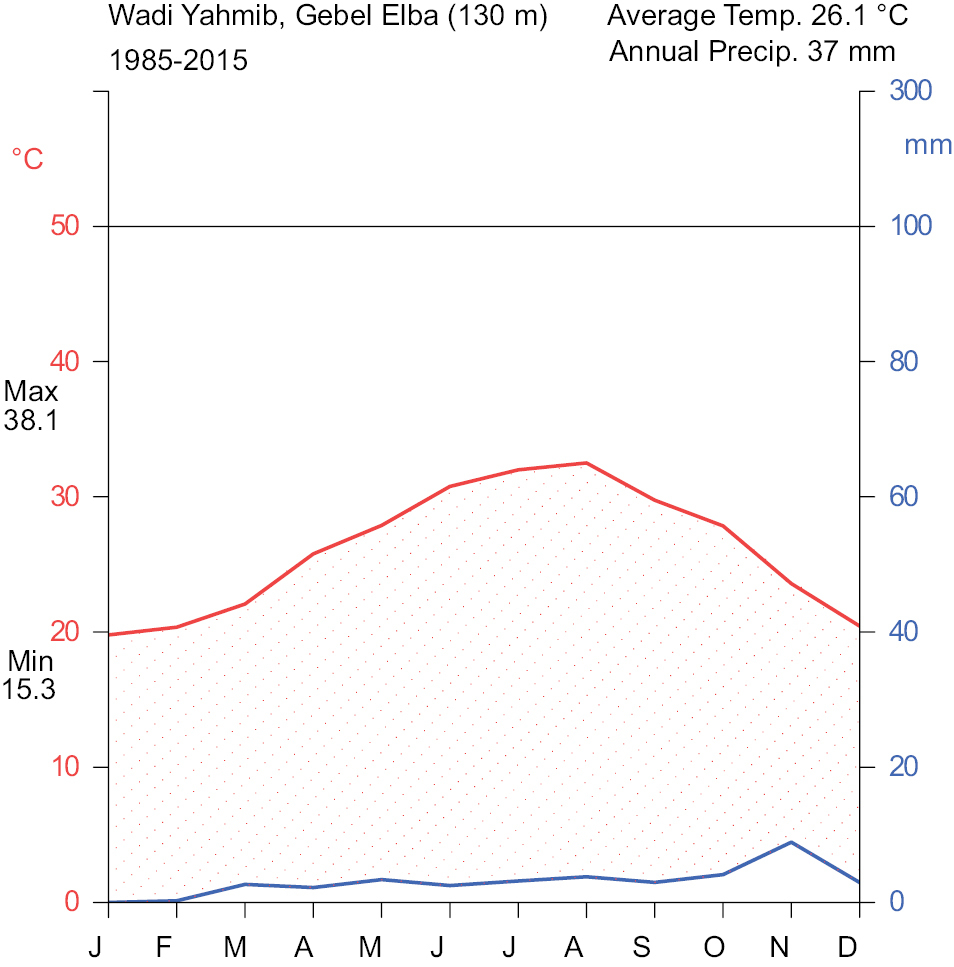
Climate diagram of Wadi Yahmib, Gebel Elba based on CRU datasets TS 4.01. Data is for the period from 1985 to 2015. The upper red line stands for mean monthly temperature of 26.1 °C (left axis); numbers beside the axis are the mean monthly maximum and minimum temperatures. The lower blue line stands for precipitation (right axis). Area shaded with dots (dotted area), above the precipitation line, and below the temperature line, indicates a dry period. |