|
||
|
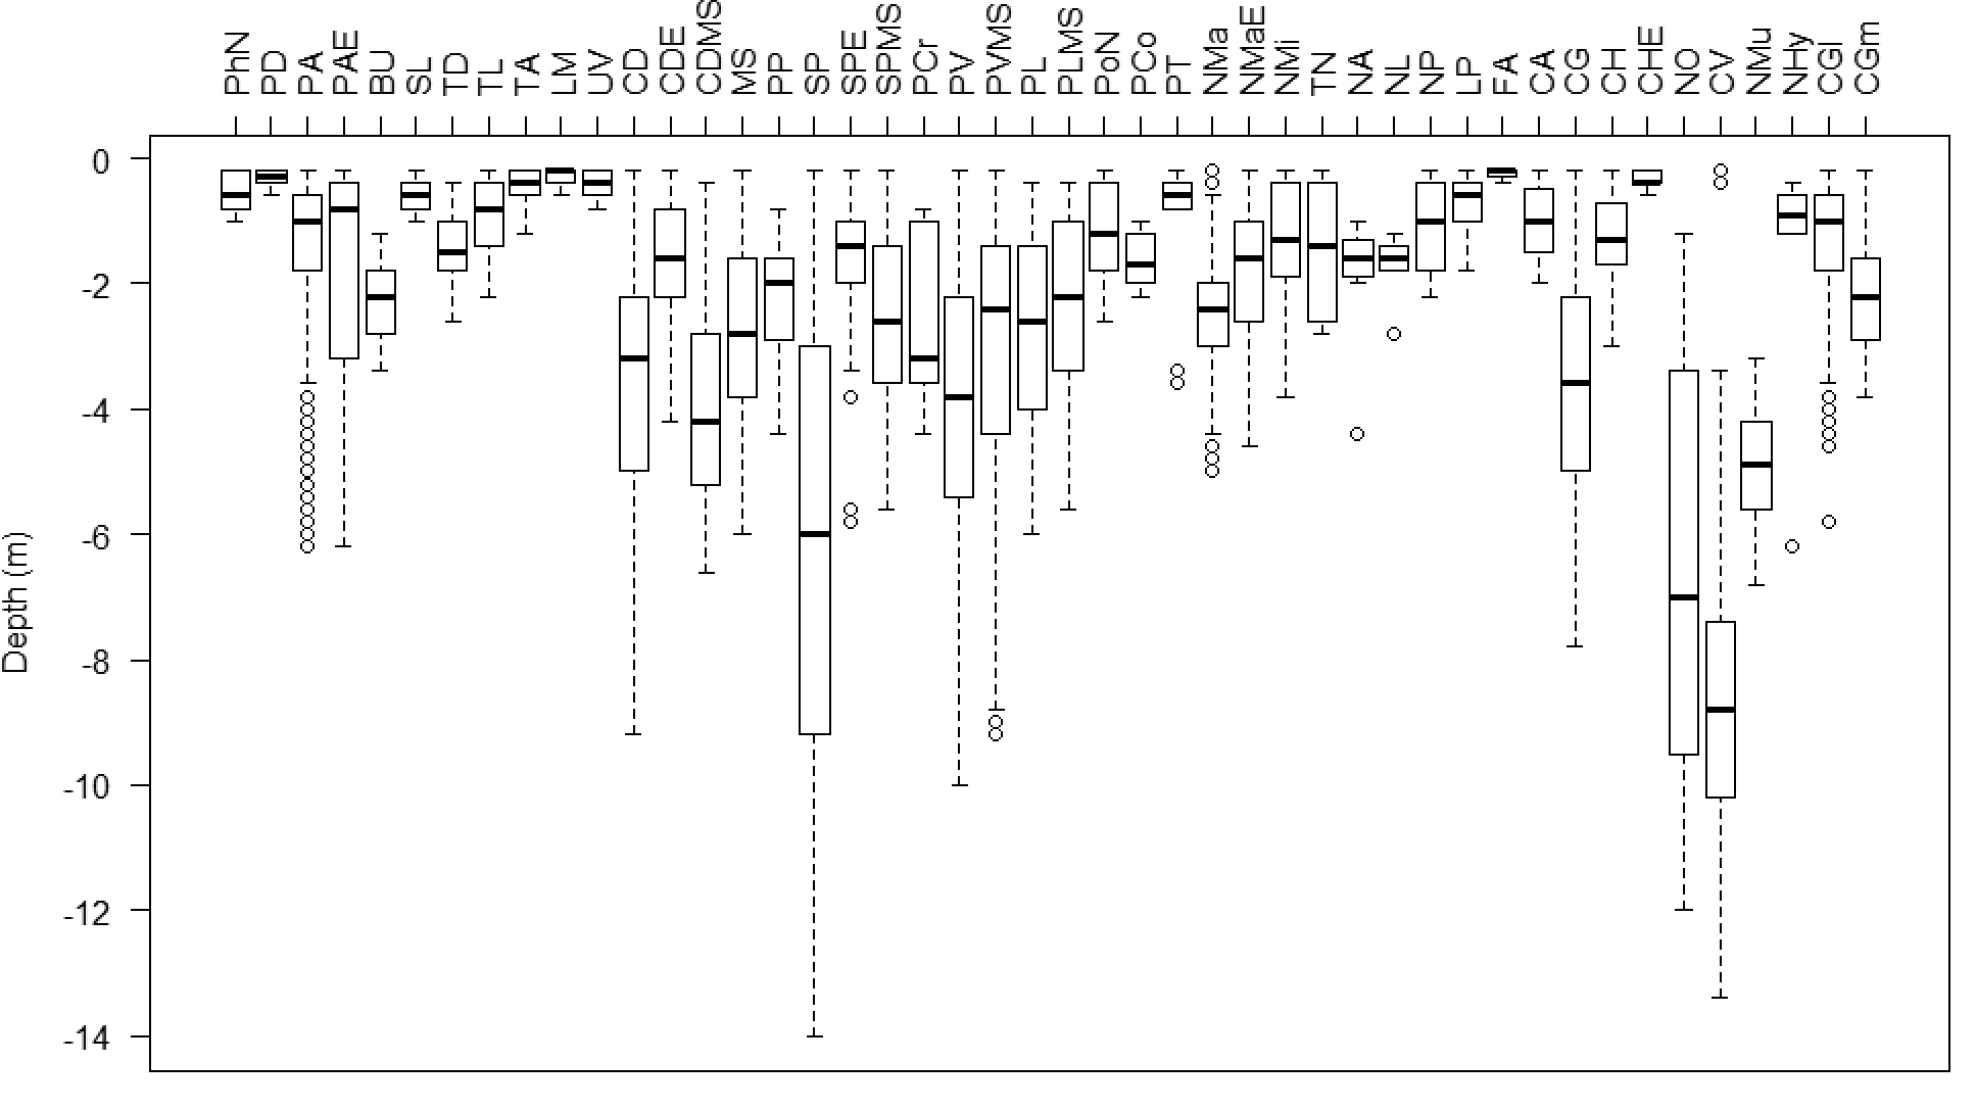
Depth distribution of the 46 described associations and communities (see related text and Table 5 for vegetation type abbreviations). Bold lines represent median values and boxplots represent the interquartile range (IQR) between first and third quartiles (25% and 75%). Whiskers represent minimum and maximum values excluding outlier values (symbolized by an empty circle), which are calculated as values beyond the range of 1.5xIQR. |