|
||
|
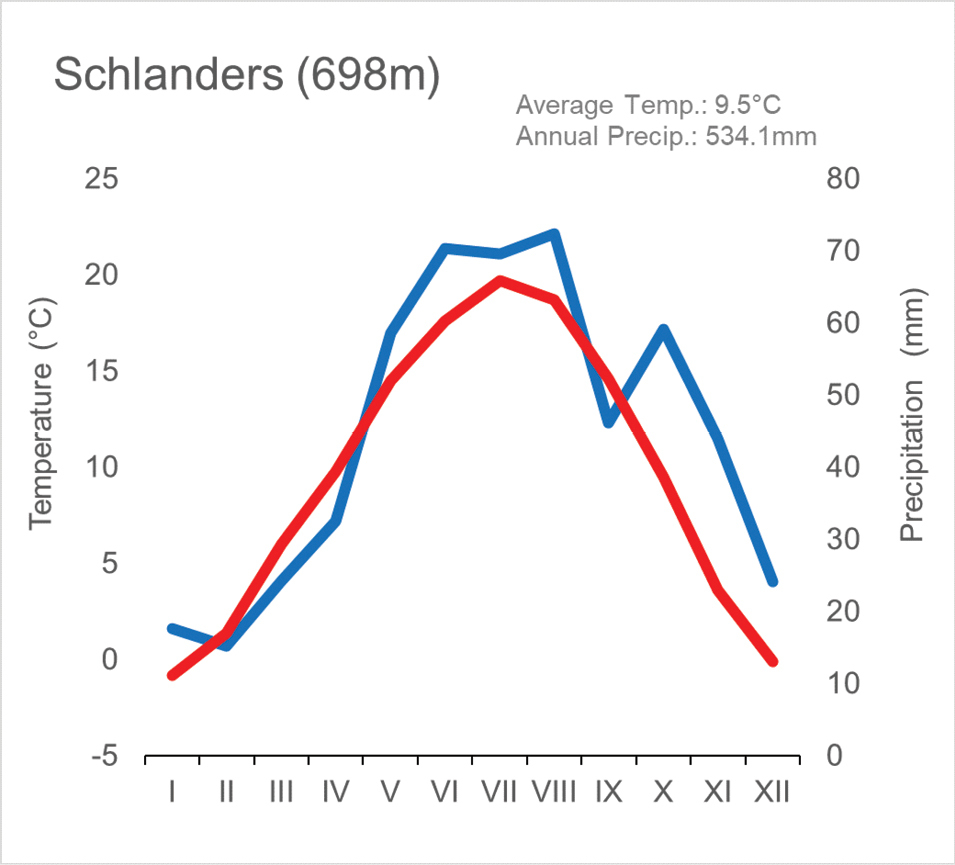
Climate diagram from Schlanders (1981–2010) based on data from the 3PCLIM-project (Source: www.3pclim.eu). The red line shows the monthly mean temperature and the blue line the precipitation. Overall, there is an average temperature of 9.5°C and an annual precipitation rate of approximately 530 mm. |