|
||
|
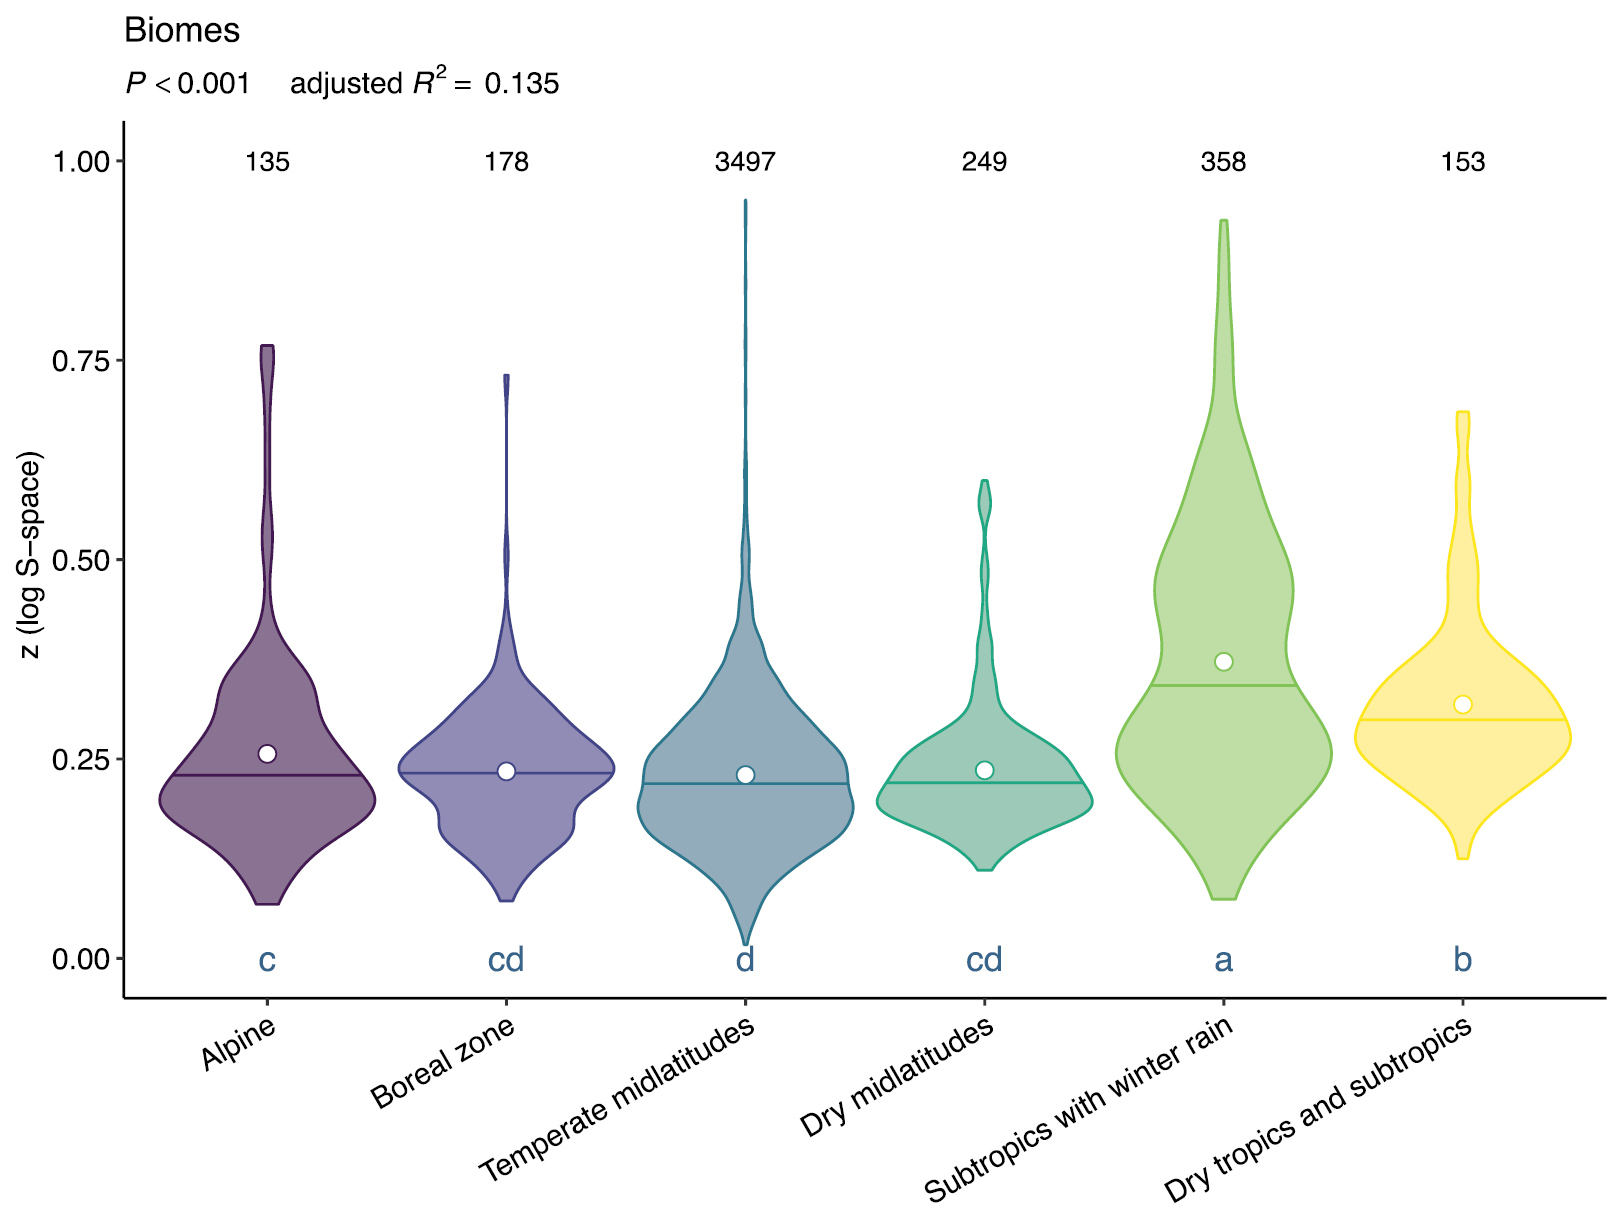
Comparison of fine-grain z-values of vascular plants between the biomes included in GrassPlot with suitable data. The biomes are sorted in descending order of latitude and elevation. The circles represent the means, the horizontal lines the medians and the letters homogeneous groups according to Tukey’s HSD post hoc test following a significant ANOVA (in decreasing order). Numbers at the top of the violin plots indicate the number of nested-plot series in each biome. |