|
||
|
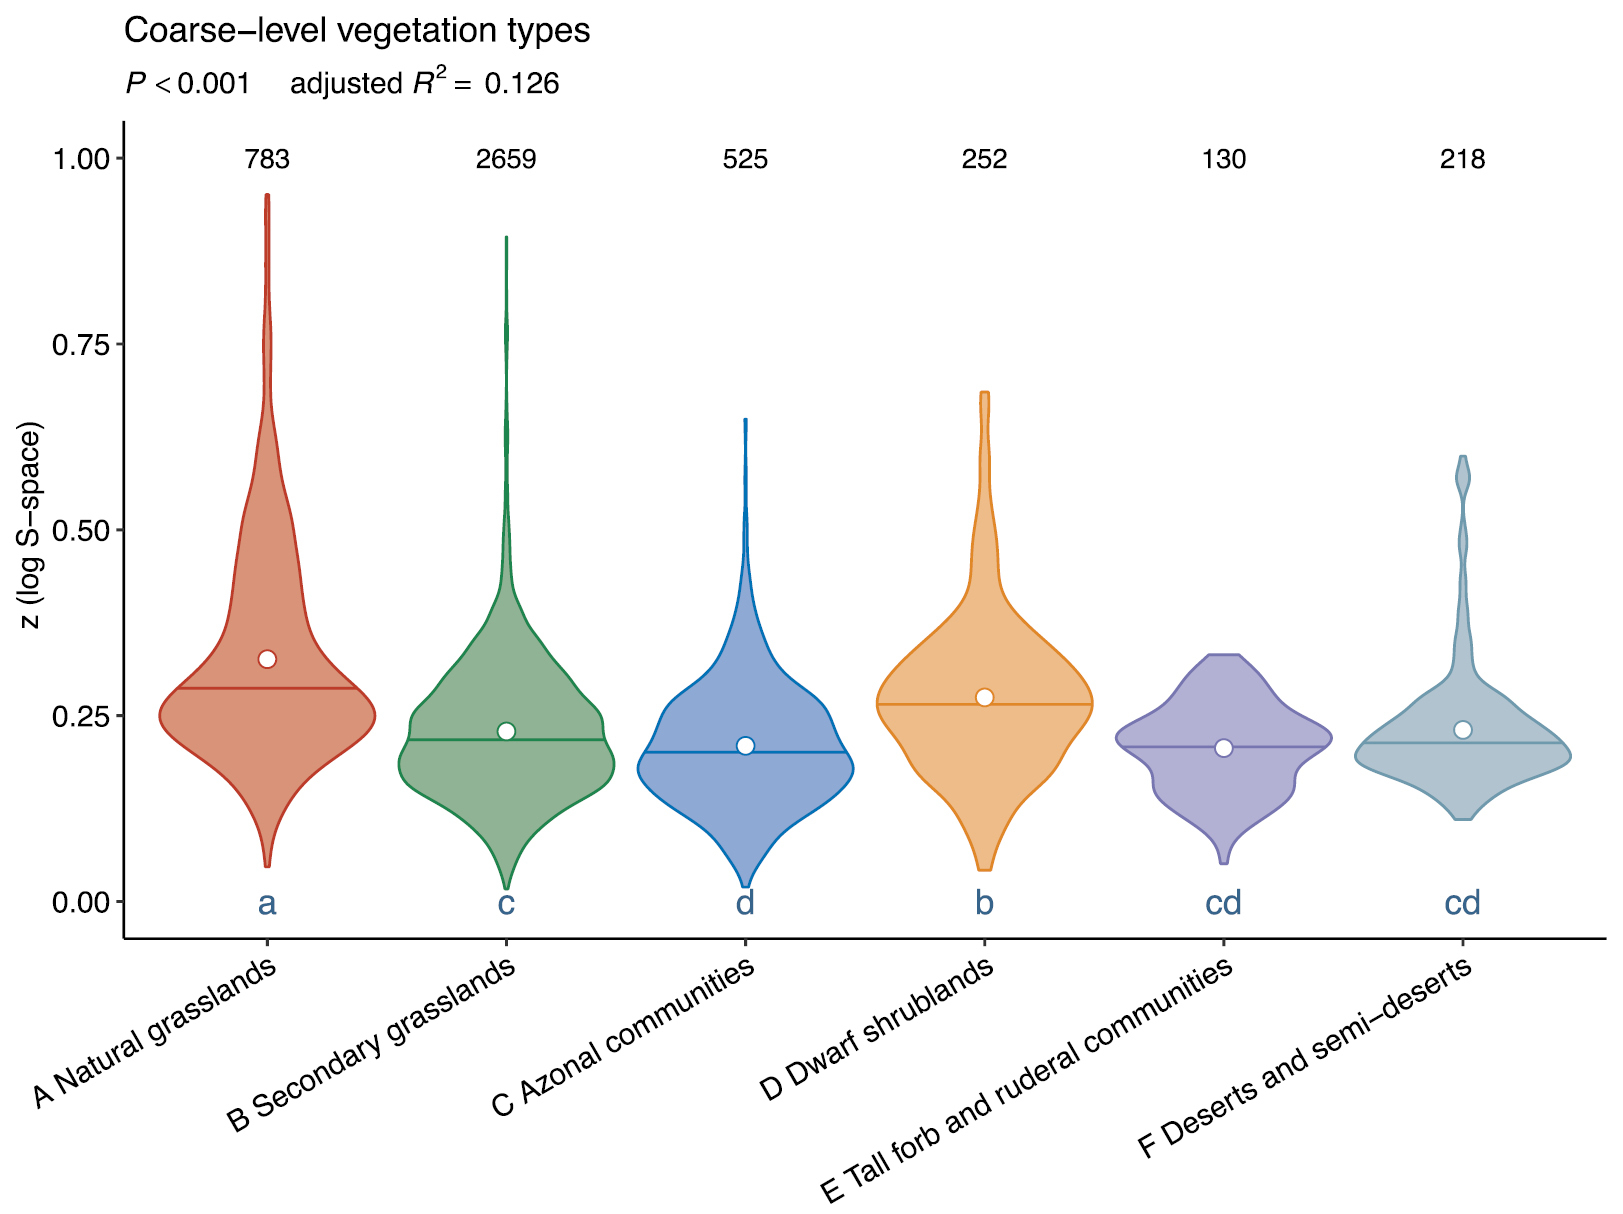
Comparison of fine-grain z-values of vascular plants between the six coarse-level vegetation types distinguished in GrassPlot. The circles represent the means, the horizontal lines the medians and the letters homogeneous groups according to Tukey’s HSD post hoc test following a significant ANOVA (in decreasing order). Numbers at the top of the violin plots indicate the number of nested-plot series in each coarse-level vegetation type. |