|
||
|
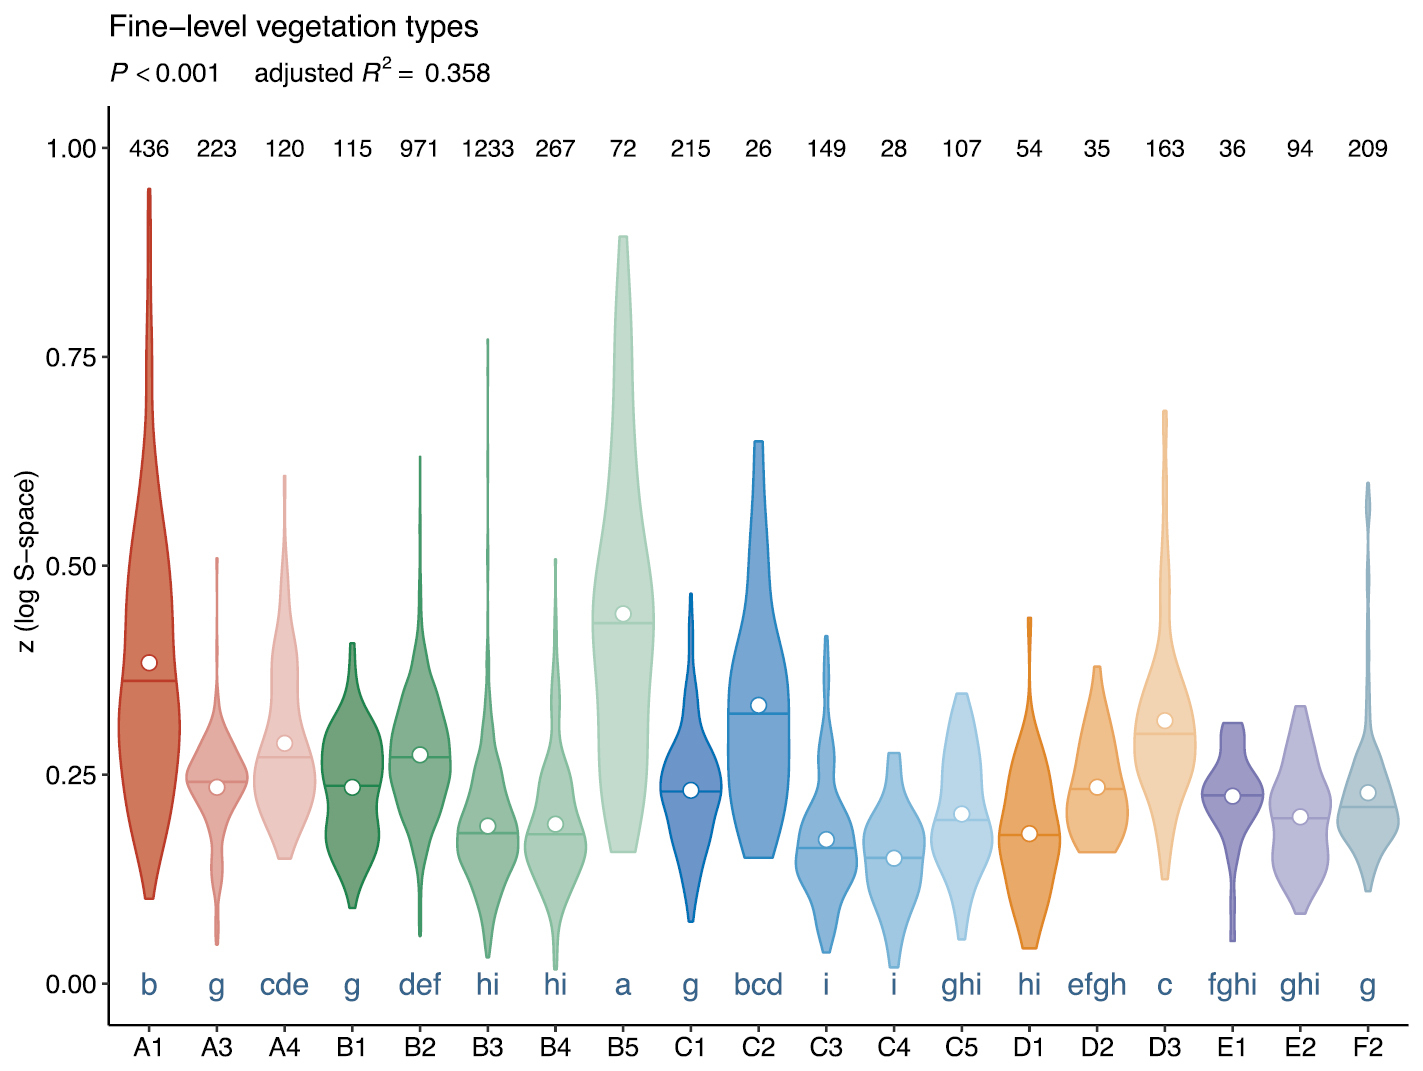
Comparison of fine-grain z-values of vascular plants between those fine-level vegetation types distinguished in GrassPlot that were represented by at least 10 observations. A1 = alpine grasslands, A3 = xeric grasslands and steppes, A4 = rocky grasslands, B1 = sandy dry grasslands, B2 = meso-xeric grasslands, B3 = mesic grasslands, B4 = wet grasslands, B5 = Mediterranean grasslands, C1 = dunes, C2 = rocks and screes, C3 = saline communities, C4 = saline steppes and semi-deserts, C5 = wetlands, D1 = lowland heathlands, D2 = arctic-alpine heathlands, D3 = garrigues and thorn-cushion communities, E1 = tall forb communities, E2 = ruderal communities, F2 = cold deserts and semi-deserts. The circles represent the means, the horizontal lines the medians and the letters homogeneous groups according to Tukey’s HSD post hoc test following a significant ANOVA (in decreasing order). Numbers at the top of the violin plots indicate the number of nested-plot series in each fine-level vegetation type. |