|
||
|
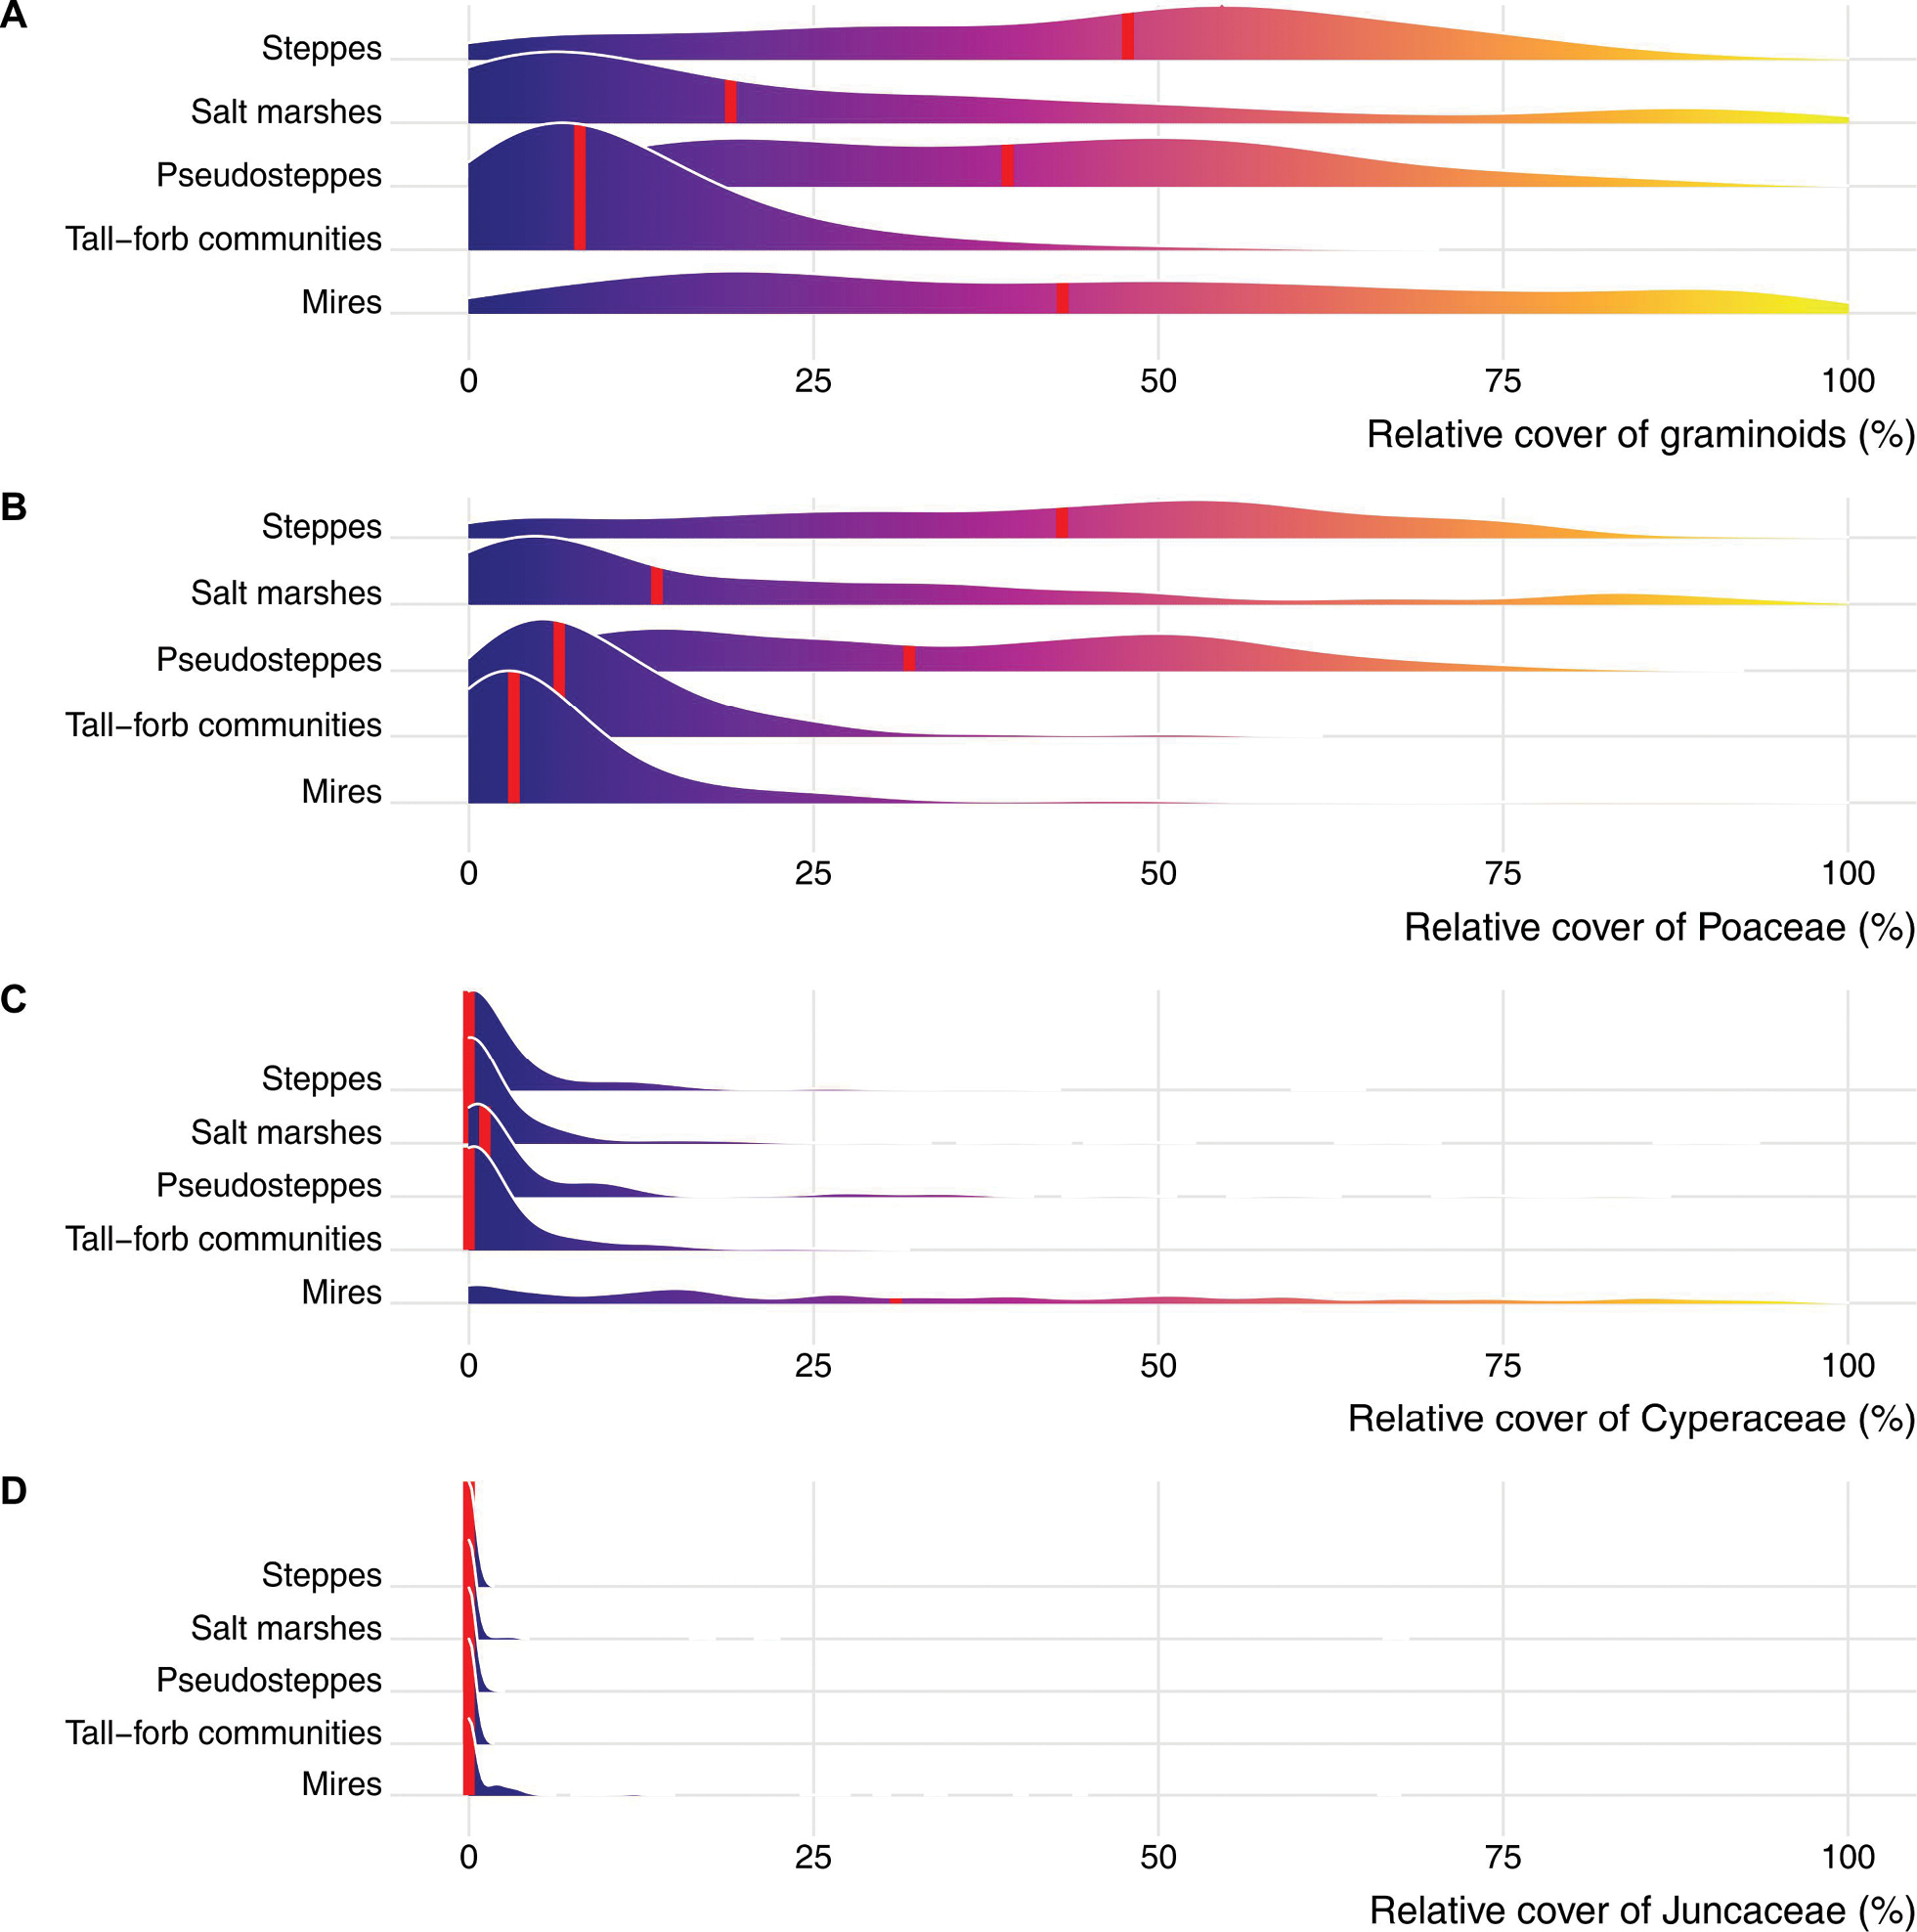
Density curves representing the distribution of relative cover (%) for all graminoids together (a) and split by family (b, c, d) within open habitat types at plot level. The vertical red line shows the median value of relative graminoid cover within each vegetation type. On the y-axis, the distributions are represented by relative values with the maximum density of each group standardized to 1. |