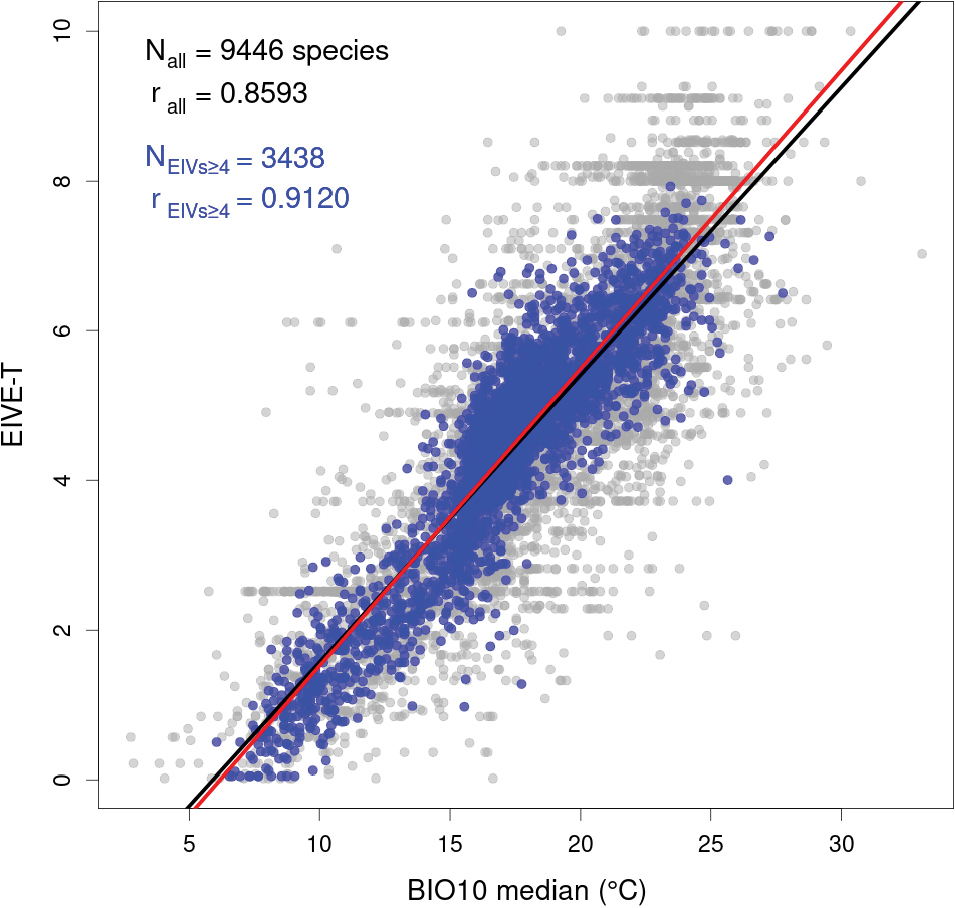
Scatter plot of the temperature indicator T of EIVE 1.0 (mean approach) and median values of the CHELSA bioclimatic variable bio10 (mean daily mean air temperatures of the warmest quarter) at GBIF coordinates of the species. The black line was fitted for all species by least squares linear regression. Species occurring in at least four EIV systems are displayed in blue and the fitted regression line for this species subset is shown in red. Species which were covered by less than four EIV systems are in grey.


  Part of: Dengler J, Jansen F, Chusova O, Hüllbusch E, Nobis MP, Van Meerbeek K, Axmanová I, Bruun HH, Chytrý M, Guarino R, Karrer G, Moeys K, Raus T, Steinbauer MJ, Tichý L, Tyler T, Batsatsashvili K, Bita-Nicolae C, Didukh Y, Diekmann M, Englisch T, Fernández-Pascual E, Frank D, Graf U, Hájek M, Jelaska SD, Jiménez-Alfaro B, Julve P, Nakhutsrishvili G, Ozinga WA, Ruprecht E-K, Šilc U, Theurillat J-P, Gillet F (2023) Ecological Indicator Values for Europe (EIVE) 1.0. Vegetation Classification and Survey 4: 7-29. https://doi.org/10.3897/VCS.98324