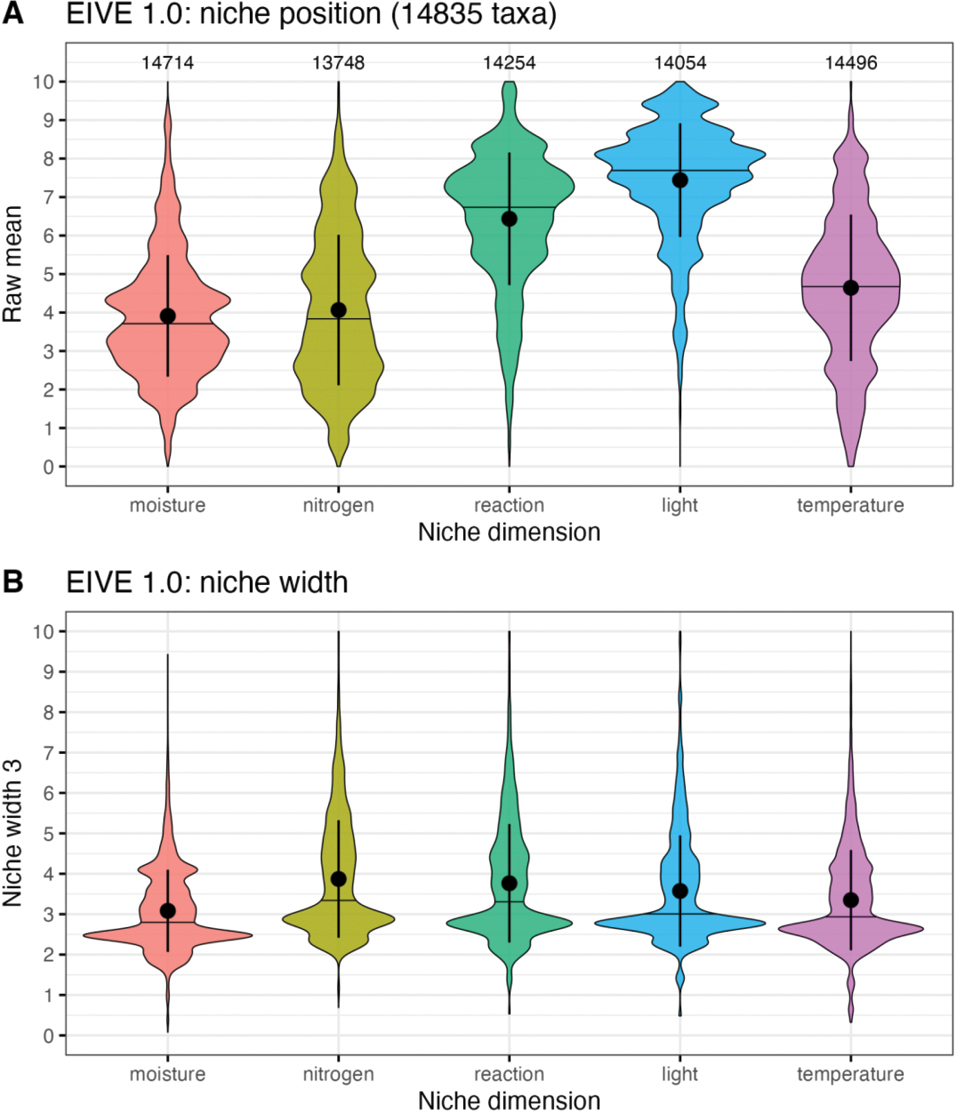
Niche position (A) and niche width (B) distribution of the five niche dimensions in EIVE 1.0. The figure refers to the accepted calculation variants, i.e. “mean” in the case of niche position and “nw3” in the case of niche width. Equal-area violin plots are displayed with median (horizontal line), mean (point) and standard deviation (vertical error bar). The number of taxa for each niche dimension is indicated at the top of the upper plot.


  Part of: Dengler J, Jansen F, Chusova O, Hüllbusch E, Nobis MP, Van Meerbeek K, Axmanová I, Bruun HH, Chytrý M, Guarino R, Karrer G, Moeys K, Raus T, Steinbauer MJ, Tichý L, Tyler T, Batsatsashvili K, Bita-Nicolae C, Didukh Y, Diekmann M, Englisch T, Fernández-Pascual E, Frank D, Graf U, Hájek M, Jelaska SD, Jiménez-Alfaro B, Julve P, Nakhutsrishvili G, Ozinga WA, Ruprecht E-K, Šilc U, Theurillat J-P, Gillet F (2023) Ecological Indicator Values for Europe (EIVE) 1.0. Vegetation Classification and Survey 4: 7-29. https://doi.org/10.3897/VCS.98324