|
Corresponding author: Maria Fungomeli ( fungomaria@yahoo.com ) Academic editor: Idoia Biurrun
© 2020 Maria Fungomeli, Anthony Githitho, Fabrizio Frascaroli, Saidi Chidzinga, Marcus Cianciaruso, Alessandro Chiarucci.
This is an open access article distributed under the terms of the Creative Commons Attribution License (CC BY 4.0), which permits unrestricted use, distribution, and reproduction in any medium, provided the original author and source are credited.
Citation:
Fungomeli M, Githitho A, Frascaroli F, Chidzinga S, Cianciaruso M, Chiarucci A (2020) A new Vegetation-Plot Database for the Coastal Forests of Kenya. Vegetation Classification and Survey 1: 103-109. https://doi.org/10.3897/VCS/2020/47180
|
Abstract
Biodiversity data based on standardised sampling designs are key to ecosystem conservation. Data of this sort have been lacking for the Kenyan coastal forests despite being biodiversity hotspots. Here, we introduce the Kenyan Coastal Forests Vegetation-Plot Database (GIVD ID: AF-KE-001), consisting of data from 158 plots, subdivided into 3,160 subplots, across 25 forests. All plots include data on tree identity, diameter and height. Abundance of shrubs is presented for 316 subplots. We recorded 600 taxa belonging to 80 families, 549 of which identified to species and 51 to genus level. Species richness per forest site varied between 43 and 195 species; mean diameter between 13.0 ± 9.8 and 30.7 ± 20.7 cm; and mean tree height between 5.49 ± 3.99 and 12.29 ± 10.61 m. This is the first plot-level database of plant communities across Kenyan coastal forests. It will be highly valuable for analysing biodiversity patterns and assessing future changes in this ecosystem.
Taxonomic reference: African Plant Database (African Plant Database version 3.4.0).
Abbreviations: DBH = diameter at breast height; GIVD = Global Index of Vegetation-Plot Databases; KECF-VPD = Kenyan Coastal Forests Vegetation Plot Database.
Keywords
Coastal forests, conservation, Global Index of Vegetation-Plot Databases, biodiversity hotspots, Kaya, Kenya, plant species diversity, sacred forests, vegetation plot
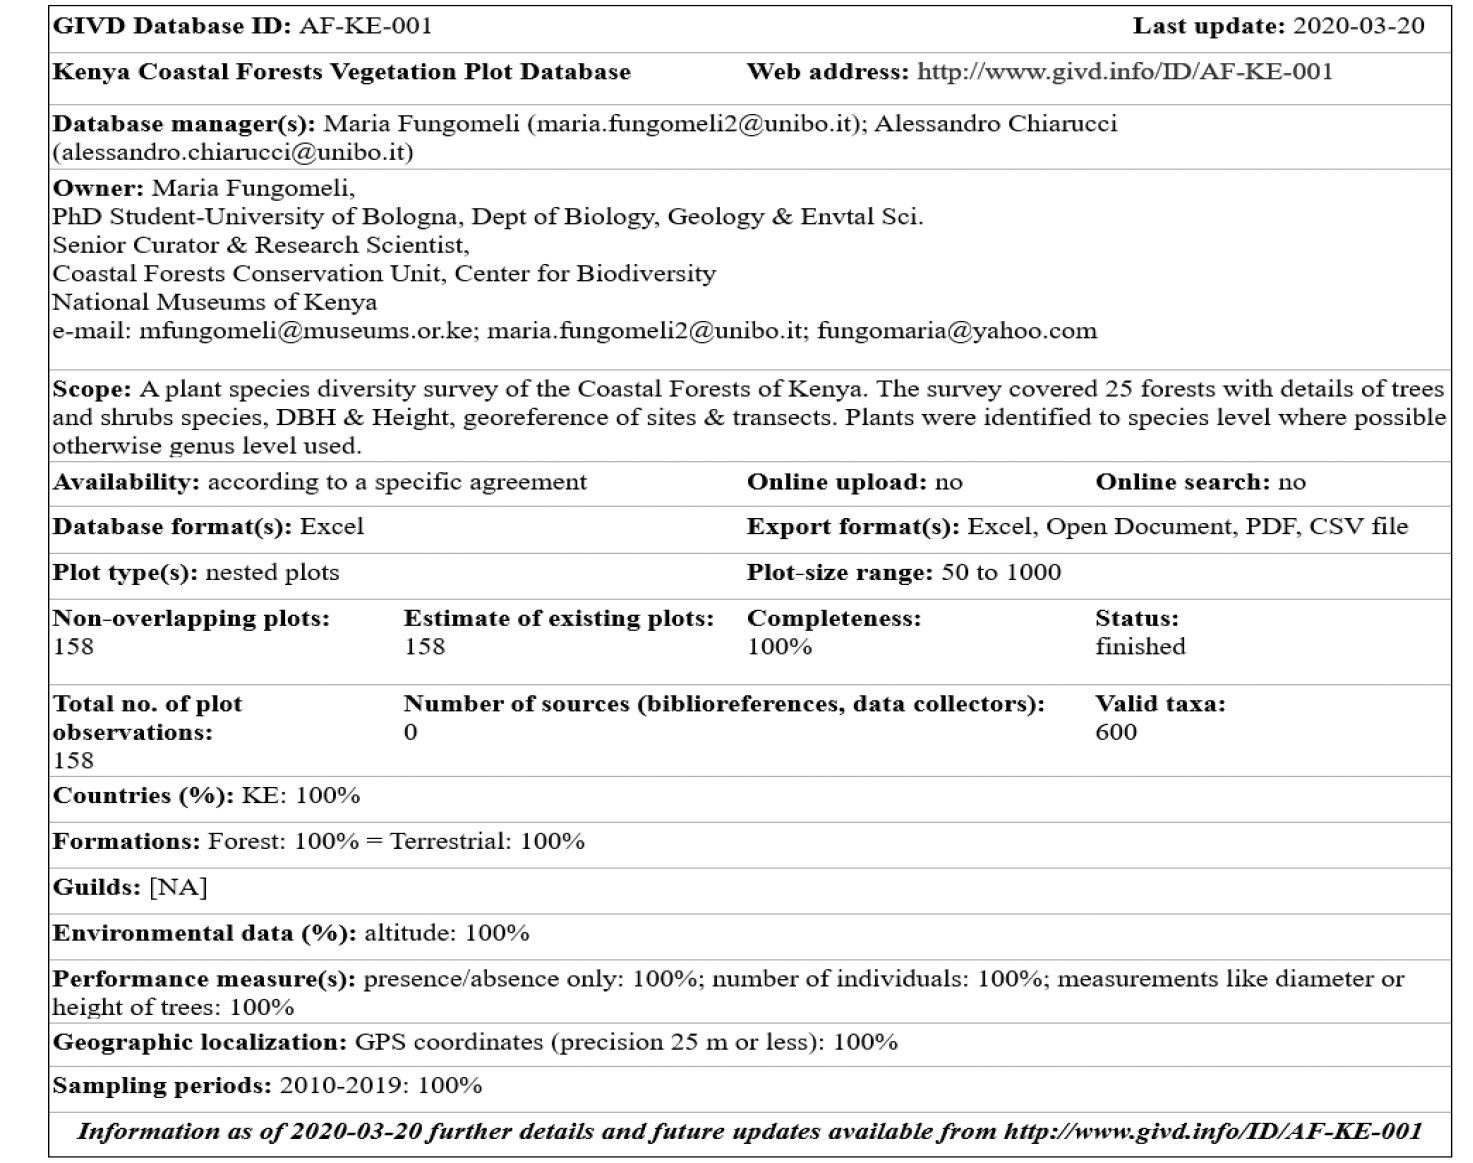
GIVD Fact Sheet: Kenya Coastal Forests Vegetation-Plot Database (KECF-VPD)
Introduction
Eastern African coastal forests are tropical forests known for their rich biodiversity and high levels of endemism, including a concentration of rare and threatened taxa and high diversity of endemic plant and animal species (
For millennia, Eastern African coastal forests have supported livelihoods both locally and regionally and played a major role as high conservation value ecosystems (
The Kenyan coastal forests fall within the Eastern African coastal forests. Despite their global significance as biodiversity hotspots (
This paper provides a basic description of a new vegetation-plot database, developed as part of a collaboration between the University of Bologna and the National Museums of Kenya. The database contains data of 25 different forest patches and was developed with the goal to produce a solid sample-based (
Study Area: the coastal forests of Kenya in the context of Eastern African forests
The coastal forests of Kenya are part of the Eastern African coastal forests ecoregion and are isolated patches of evergreen to semi-evergreen closed canopy forests. They present unique remnants of indigenous ecosystems and are part of the North Zanzibar-Inhambane Regional Mosaic, which extends from southern Somalia through coastal Kenya to southern Tanzania, including the islands of Zanzibar and Pemba (
The climatic range of the Kenyan coastal forests is tropical with coastal high humidity (
It is estimated that approximately 3,170 km2 of Eastern African coastal forests remains in Somalia, Kenya, Tanzania, Mozambique, Zimbabwe and Malawi. Approximately 20% of these forests are found in Kenya (
The size and protection status of the Kenyan coastal forests is highly variable. The two largest remaining forests are Arabuko Sokoke (42,000 ha) and Shimba Hills (25,300 ha), which are government protected forest reserves (Table
Overview of the forest sites included in the Kenyan coastal forest vegetation-plot database, with an indication of their protection status, geographical coordinates, area, number of plots and recorded total species richness per forest site.
| Forest ID | Forest name | Protection status | Latitude decimal degree | Longitude decimal degree | Area (ha) | Number of plots | Species richness |
|---|---|---|---|---|---|---|---|
| Arabuko | Arabuko Sokoke forest | Forest reserve | -3.32138, 39.92917 | 42,000 | 26 | 178 | |
| Bomu | Kaya Bomu | Sacred forest | -3.93354, 39.59635 | 409 | 8 | 154 | |
| Buda | Buda forest | Forest reserve | -4.45812, 39.39683 | 670 | 6 | 121 | |
| Chivara | Kaya Chivara | Sacred forest | -3.69452, 39.69132 | 150 | 8 | 140 | |
| Chonyi | Kaya Chonyi | Sacred forest | -4.06953, 39.53038 | 200 | 4 | 62 | |
| Diani | Kaya Diani | Sacred forest | -4.27523, 39.58520 | 20 | 3 | 66 | |
| Dzombo | Dzombo forest | Forest reserve | -4.42945, 39.21545 | 650 | 6 | 90 | |
| Fungo | Kaya Fungo | Sacred forest | -3.80068, 39.51047 | 204 | 4 | 60 | |
| Gandini | Gandini forest | Sacred forest | -4.03443, 39.50988 | 150 | 5 | 80 | |
| Gogoni | Gogoni forest | Forest reserve | -4.41013, 39.47628 | 832 | 6 | 123 | |
| Jibana | Kaya Jibana | Sacred forest | -3.84048, 39.67382 | 140 | 8 | 195 | |
| Kambe | Kaya Kambe | Sacred forest | -3.86766, 39.65363 | 75 | 6 | 109 | |
| Kauma | Kaya Kauma | Sacred forest | -3.62968, 39.73778 | 75 | 7 | 77 | |
| Kinondo | Kaya Kinondo | Sacred forest | -4.39427, 39.54703 | 30 | 3 | 56 | |
| Marenje | Marenje forest | Forest reserve | -4.48458, 39.25906 | 1,480 | 6 | 76 | |
| Mrima | Mrima forest | Forest reserve | -4.48573, 39.26883 | 377 | 6 | 101 | |
| Mtswakara | Kaya Mtswakara | Sacred forest | -4.00017, 39.51997 | 248 | 4 | 64 | |
| Muhaka | Kaya Muhaka | Sacred forest | -4.32568, 39.52328 | 150 | 5 | 90 | |
| Muvya | Kaya Mudzimuvya | Sacred forest | -3.94175, 39.58190 | 171 | 4 | 85 | |
| Mwiru | Kaya Mudzimwiru | Sacred forest | -3.95913, 39.57372 | 147 | 4 | 70 | |
| Ribe | Kaya Ribe | Sacred forest | -3.89922, 39.63363 | 36 | 5 | 95 | |
| Shimba | Shimba Hills forest | Forest reserve | -4.26940, 39.37208 | 25,300 | 12 | 190 | |
| Teleza | Kaya Teleza | Sacred forest | -4.14147, 39.50342 | 67 | 6 | 91 | |
| Tiwi | Kaya Tiwi | Sacred forest | -4.25704, 39.59817 | 10 | 3 | 53 | |
| Waa | Kaya waa | Sacred forest | -4.19970, 39.61565 | 30 | 3 | 43 |
Data collection
Sampling was based on a nested plot design consisting of 158 rectangular plots located in 25 forests sites of the Kenyan coastal forests spanning along the coastline, from north to south (Figure

A Map of Eastern Africa area highlighting the coastal area of Kenya. B Coastal forests of Kenya spanning from North to South (all forests identified by green colour with and without numbers), the numbered are the sampled sites with their protection status. 1 = Arabuko, 2 = Bomu, 3 = Buda, 4 = Chivara, 5 = Chonyi, 6 = Diani, 7 = Dzombo, 8 = Fungo, 9 = Gandini, 10 = Gogoni, 11 = Jibana, 12 = Kambe, 13 = Kauma, 14 = Kinondo, 15 = Marenje, 16 = Mrima, 17 = Mtswaka, 18 = Muhaka, 19 = Muvya, 20 = Mwiru, 21 = Ribe, 22 = Shimba, 23 = Teleza, 24 = Tiwi, 25 = Waa.
To standardise sampling intensity, the number of plots per forest site was approximately proportional to the forest site area, although with some variation due to site accessibility and fragmentation. The location of the plots within each forest site was randomised with minor adaptations due to accessibility. A minimum distance of 200 m between plots per site was maintained to maximise spatial variation. The plots were laid with a north-south orientation, had a standard size of 10 m × 100 m and were further sub-divided into twenty 10 m × 5 m subplots for a total of 3,160 subplots across the entire study system. We sampled and identified at the species level all woody plant individuals with diameter at breast height (DBH) ≥ 5 cm (mostly trees) rooted within each subplot. For each tree, besides DBH, we also measured the height with a hand held clinometer (Suunto PM-5), or a calibrated measuring pole (50 m) in areas with dense forests where clinometer was difficult to use. Woody plant individuals with DBH < 5 cm, mostly shrubs, were sampled and identified in two of the twenty subplots within a plot, where one was randomly selected in the northern half (subplots 1–10) and the second in the southern half (subplots 11–20) of the plot. The abundance of shrub species was assessed by counting the number of individual shoots rooted within the subplot.
Plants were identified on-site to the species or at least genus level by local botanists and with the use of botanical manuals using standard references for the area (
Database content
The Kenyan coastal forests vegetation-plot database (KECF-VPD) is registered at the Global Index of Vegetation Database (http://www.givd.info/ID/AF-KE-001). It consists of vegetation data collected in 158 nested plots across 25 forests sites (Table
In total, 19 families had more than 10 species (Table
List of the most diverse families in the Kenyan coastal forests vegetation-plot database, defined as those having at least 10 different recorded species.
| Family | Number of species |
|---|---|
| Rubiaceae | 63 |
| Leguminosae | 61 |
| Malvaceae | 34 |
| Euphorbiaceae | 30 |
| Annonaceae | 24 |
| Moraceae | 23 |
| Sapindaceae | 22 |
| Apocynaceae | 20 |
| Sapotaceae | 18 |
| Rutaceae | 17 |
| Celastraceae | 16 |
| Combretaceae | 16 |
| Lamiaceae | 16 |
| Capparaceae | 15 |
| Ebenaceae | 14 |
| Acanthaceae | 12 |
| Phyllanthaceae | 12 |
| Salicaceae | 11 |
| Anacardiaceae | 10 |
The frequency distribution of species richness per plot showed a slightly right-skewed distribution (Figure
Basic forest structure varied across sites (Table

List of the 20 most frequent species per plot (n = 158 plots), including family, habit, number of plots in which they have been recorded, and DBH and height (mean ± standard deviation) for species with DBH ≥ 5cm.
| Species | Family | Habit | Number of plots | DBH (mean ± sd) (cm) | Height (mean ± sd) (m) |
|---|---|---|---|---|---|
| Uvaria acuminata | Annonaceae | tree | 95 | 7.4 ± 2.13 | 7.54 ± 7.08 |
| Haplocoelum inoploeum | Sapindaceae | tree | 94 | 11.9 ± 7.46 | 5.51 ± 2.71 |
| Polysphaeria parvifolia | Rubiaceae | tree | 69 | 5.6 ± 0.57 | 2.75 ± 0.67 |
| Salacia elegans | Celastraceae | liana | 69 | 7.3 ± 1.87 | 7.14 ± 2.78 |
| Combretum schumannii | Combretaceae | tree | 66 | 18.5 ± 16.97 | 9.24 ± 5.74 |
| Hymenaea verrucosa | Leguminosae | tree | 66 | 33.9 ± 21.36 | 15.73 ± 8.50 |
| Landolphia kirkii | Apocynaceae | liana | 66 | 9.5 ± 3.79 | 8.21 ± 3.33 |
| Monanthotaxis fornicata | Annonaceae | shrub | 66 | – | – |
| Synaptolepis kirkii | Thymelaeaceae | shrub | 64 | – | – |
| Cassipourea euryoides | Rhizophoraceae | tree | 63 | 14.7 ± 8.64 | 8.21 ± 4.02 |
| Asteranthe asterias | Annonaceae | tree | 57 | 6.2 ± 1.60 | 3.09 ± 1.03 |
| Manilkara sansibarensis | Sapotaceae | tree | 57 | 18.2 ± 11.43 | 9.41 ± 5.06 |
| Cola minor | Malvaceae | tree | 56 | 12.8 ± 7.79 | 5.75 ± 3.18 |
| Grewia plagiophylla | Malvaceae | tree | 56 | 12.2 ± 5.71 | 5.15 ± 2.30 |
| Pyrostria bibracteata | Rubiaceae | tree | 56 | 8.6 ± 5.38 | 4.25 ± 2.46 |
| Combretum illairii | Combretaceae | liana | 54 | 11.1 ± 13.82 | 6.00 ± 5.51 |
| Lecaniodiscus fraxinifolius | Sapindaceae | tree | 54 | 20.4 ± 15.06 | 8.29 ± 5.15 |
| Deinbollia borbonica | Sapindaceae | tree | 52 | 6.7 ± 1.75 | 2.90 ± 0.66 |
| Allophylus pervillei | Sapindaceae | tree | 51 | 7.0 ± 1.92 | 3.36 ± 0.83 |
| Suregada zanzibariensis | Euphorbiaceae | tree | 51 | 7.0 ± 2.23 | 3.83 ± 1.42 |
Basic structural data of the Kenyan coastal forest sites expressed as mean (± standard deviation) of the DBH and height, and number of measured trees (n).
| Site | DBH (mean ± sd) (cm) | Height (mean ± sd) (m) | n |
|---|---|---|---|
| Arabuko | 15.3 ± 12.55 | 7.73 ± 4.74 | 2163 |
| Bomu | 25.2 ± 22.28 | 9.99 ± 8.07 | 275 |
| Buda | 16.6 ± 15.14 | 7.94 ± 6.28 | 658 |
| Chivara | 13.0 ± 9.80 | 7.26 ± 4.78 | 539 |
| Chonyi | 17.3 ± 15.91 | 6.79 ± 5.10 | 216 |
| Diani | 16.0 ± 23.26 | 5.49 ± 3.99 | 412 |
| Dzombo | 18.9 ± 20.84 | 7.71 ± 5.77 | 470 |
| Fungo | 17.0 ± 14.80 | 8.74 ± 5.74 | 208 |
| Gandini | 17.3 ± 12.02 | 7.39 ± 4.45 | 270 |
| Gogoni | 17.5 ± 16.80 | 7.50 ± 6.10 | 709 |
| Jibana | 18.6 ± 19.45 | 9.71 ± 7.95 | 972 |
| Kambe | 24.5 ± 25.37 | 12.29 ± 10.61 | 274 |
| Kauma | 13.4 ± 28.18 | 7.29 ± 4.67 | 253 |
| Kinondo | 19.5 ± 17.83 | 9.56 ± 6.92 | 468 |
| Marenje | 16.3 ± 14.18 | 7.81 ± 5.91 | 579 |
| Mrima | 15.7 ± 15.56 | 7.12 ± 5.72 | 485 |
| Mtswaka | 30.7 ± 20.71 | 11.76 ± 7.42 | 176 |
| Muhaka | 24.1 ± 20.97 | 10.52 ± 8.39 | 414 |
| Muvya | 24.8 ± 20.57 | 10.69 ± 8.90 | 110 |
| Mwiru | 24.6 ± 20.19 | 10.64 ± 6.79 | 153 |
| Ribe | 15.5 ± 17.67 | 7.62 ± 5.74 | 299 |
| Shimba | 15.6 ± 17.16 | 7.51 ± 6.04 | 1345 |
| Teleza | 17.9 ± 11.03 | 8.83 ± 5.03 | 556 |
| Tiwi | 14.3 ± 17.73 | 5.59 ± 3.93 | 464 |
| Waa | 15.8 ± 11.84 | 6.47 ± 4.10 | 410 |
Conclusion
The KECF-VPD database represents the first vegetation dataset collected according to a standardised plot-based design across Kenyan coastal forests. This database represents a snapshot of the vegetation in a relevant fraction of the existing forest patches in the region. As such, the database provides the best available picture of the current patterns of woody plant biodiversity of these forests. Since the sampling design was based on different scale levels (forest sites, plots and subplots), the database also offers a unique opportunity for exploring the patterns and determinants of plant diversity in the Kenyan Coastal forests across spatial scales. These data will provide a tool and baseline for assessing future changes in the study system.
Future perspectives
The current KECF-VPD database covers 25 Kenyan coastal forests. There is potential to extend the survey to the remaining coastal forests not covered by this research. The database is presently being explored for analysing species diversity data, in terms of species-area relationships, beta diversity and species composition. A successive phase will also be to develop a biodiversity monitoring platform for these forests. Such a platform could be shared with the institutions, organisations and communities working and living around these forests to promote their conservation and sustainable management. Furthermore, integrating socio-economic aspects into the research would be essential to capture local level forest use by adjacent communities and their attitude towards forest management and conservation.
Data availability
The database is presently stored at the University of Bologna. Its availability is currently restricted to the PhD project within which it was developed. Possible uses by other interested researchers are presently limited on the bases of specific agreement to be discussed with the database administrators. After an embargo period, the data will be contributed to sPlot – the global vegetation plot database (
Author contributions
A.C conceptualised the idea and provided overall supervision. M.F, F.F and A.C developed the field work sampling design. A.G guided on overall study area briefing, forest sites selection and accessibility. M.F carried out the field work, collected, compiled, standardised data and prepared the manuscript. S.C contributed to field sampling and plant specimen identification. M.C reviewed the species data and verified taxonomy for African and tropical vegetation species. All authors contributed to the final manuscript.
Acknowledgements
Authors are indebted to University of Bologna, Department of Biological, Geological and Environmental Sciences, International Association of Butterfly Exhibitors and Suppliers, National Museums of Kenya, Nature Kenya and WWF-Kenya for funding and logistical support received. Special thanks to Geoffrey Mashauri and Abbas Shariff for assistance in plant identification We are grateful to Lawrence Chiro and Abdulrahman Matano (Coastal forests conservation unit-NMK); Dr Tito E. Mbuvi and Joseph Muthini (Kenya Forest Research Institute); George Wara and Blessingtone Magangha (Kenya Forest Service) for field sampling assistance. We would like to acknowledge Prof. Idoia Biurrun and two other anonymous reviewers for comments and suggestions on previous version of the manuscript, and Megan J. McNellie for linguistic editing.
References
- African Plant Database (2019) Conservatoire et Jardin botaniques de la Ville de Genève, Geneva, CH and South African National Biodiversity Institute, Pretoria, ZA (version 3.4.0). https://www.ville-ge.ch/musinfo/bd/cjb/africa/recherche.php/ [accessed 9 Dec 2019]
- Azeria ET, Sanmartin I, Stephan AS, Carlson A, Burgess ND (2007) Biogeographic patterns of the East African coastal forest vertebrate fauna. Biodiversity and Conservation 16: 883–912. https://doi.org/10.1007/s10531-006-9022-0
- Beentje HJ (1994) Kenya Trees, Shrubs and Lianas. National Museums of Kenya, Nairobi, 722 pp.
- Bruelheide H, Dengler J, Jiménez-Alfaro B, Purschke O, Hennekens SM, Chytrý M, Pillar VD, Jansen F, Kattge J, ... Winter M (2019) sPlot: A new tool for global vegetation analyses. Journal of Vegetation Science 30: 161–186.
- Burgess ND, Clarke GP, Rodgers WA (1998) Coastal forests of Eastern Africa: status, endemism patterns and their potential causes. Biological Journal of the Linnean Society 64: 337–367. https://doi.org/10.1111/j.1095-8312.1998.tb00337.x
- Burgess ND, Clarke GP [Eds] (2000) The Coastal Forests of Eastern Africa. IUCN, Gland, CH and Cambridge, UK, 443 pp.
- Cayuela L, Stein A, Oksanen J (2017) Taxonstand: Taxonomic standardization of plant species names. R package version 2.1. https://CRAN.R-project.org/package=Taxonstand [accessed 15 July 2019]
- Chiarucci A (2007) To sample or not to sample? That is the question for the vegetation scientist. Folia Geobotanica 42: 209–216. https://doi.org/10.1007/BF02893887
- Githitho AN (2004) The coastal terrestrial forests of Kenya: A report on resources threats and investments. A report to WWF Eastern coastal forest programme. http://coastalforests.tfcg.org/pubs/CFResource-Ken.pdf [accessed 3 Oct 2019]
- Githitho AN (2016) Listing the sacred Mijikenda kaya Forests as UNESCO World Heritage Sites: The Long Journey, Journal des africanistes [En ligne], 86-1, mis en ligne le 10 avril 2018. http://journals.openedition.org/africanistes/4971 [accessed 3 Oct 2019]
- Glover J, Robinson P, Henderson JP (1954) Provisional maps of the reliability of annual rainfall in East Africa. Quarterly Journal of the Meteorological Society 80: 1–607. https://doi.org/10.1002/qj.49708034609
- Habel J, Constanza I, Zamora C, Teucher M, Hornetz B, Shauri H, Mulwa R, Lens L (2017) East African coastal forest under pressure. Biodiversity and Conservation 26: 2751–2758. https://doi.org/10.1007/s10531-017-1375-z
- Hobohm C, Janišová M, Steinbauer MJ, Landi S, Field R, Vanderplank S, Beierkuhnlein C, Grytnes J-A, Vetaas OR, … Chiarucci A (2019) Global endemics-area relationships of vascular plants. Perspectives in Ecology and Conservation 17: 41–49. https://doi.org/10.1016/j.pecon.2019.04.002
- Lovett JC (1998) Eastern Tropical African Centre of Endemism: A Candidate for World Heritage Status. Journal of East African Natural History 87: 359–366. https://doi.org/10.2982/0012-8317(1998)87[359:ETACOE]2.0.CO;2
- Luke WRQ (2005) Annotated check-list of the plants of the Shimba Hills, Kwale District, Kenya. Journal of East African Natural History 94: 5–121. https://doi.org/10.2982/0012-8317(2005)94[5:ACOTPO]2.0.CO;2
- Luke WRQ, Githitho AN (2016) Biodiversity and the Kaya forests. In: Hoorweg J, Muthiga N (Eds) Recent Advances in Coastal Ecology: Studies from Kenya. African Studies Centre, Leiden, 293–301. https://www.oceandocs.org/bitstream/handle/1834/9014/ktf70ex1253933-067-20
- Metcalfe K, French-Constant R, Gordon I (2010) Sacred sites as hotspots for biodiversity: The Three Sisters Cave complex in coastal Kenya. Oryx 44: 118–123. https://doi.org/10.1017/S0030605309990731
- Moomaw JC (1960) A Study of the Plant Ecology of the Coast Region of Kenya, East Africa. Government Printer, Nairobi, 62 pp. https://edepot.wur.nl/493400
- Montagnini F, Jordan CF (2010) Tropical Forest Ecology. Springer, Berlin, 295 pp. https://doi.org/10.1007/b138811
- Myers N, Mittermeier RA, Mittermeier CG, da Fonseca GAB, Kent J (2000) Biodiversity hotspots for conservation priorities. Nature 403: 853–858. https://doi.org/10.1038/35002501
- Noad T, Birnie A (1990) A Fully Illustrated Field Guide: Trees of Kenya. General Printers Ltd, Nairobi, 350 pp.
- Peltorinne P (2004) The forest types of Kenya. In: Pellikka P, Ylhäisi J, Clark B (Eds) Taita Hills and Kenya, 2004 – seminar, reports and journal of a field excursion to Kenya [Expedition reports of the Department of Geography 40]. University of Helsinki, Helsinki, 8–13.
- Robertson SA, Luke WRQ (1993) The vegetation and conservation status of Kaya coastal forests in Kenya. WWF, Nairobi, 425 pp. https://www.africabib.org/rec.php?RID=K00001940
- Wass P [Ed.] (1995) Kenya’s indigenous forests: status, management and conservation. IUCN, Gland, CH and Cambridge, UK, 220 pp. https://portals.iucn.org/library/sites/library/files/documents/FR-014.pdf
E-mail and ORCID
Maria Fungomeli (Corresponding author, maria.fungomeli2@unibo.it), ORCID: https://orcid.org/0000-0002-8963-6405
Anthony Githitho (anthony.githitho@yahoo.com)
Fabrizio Frascaroli (fabrizio@lomonlus.org)
Saidi Chidzinga (chidzinga@gmail.com)
Marcus Cianciaruso (cianciaruso@gmail.com), ORCID: https://orcid.org/0000-0001-5866-5345
Alessandro Chiarucci (alessandro.chiarucci@unibo.it), ORCID: https://orcid.org/0000-0003-1160-235X