Does the use of ordinal cover scales bias biodiversity metrics?
Post, originallly published to https://vegsciblog.org/, provided by Iwona Dembicz & Jürgen Dengler.
When sampling vegetation plots, vegetation ecologists usually estimate the importance of the occurring plant species by their cover. However, instead of directly estimating the cover in percent, up to now most researchers seem to use one of the many available ordinal scales and their variants. For example, in the global vegetation-plot database sPlot, 66% of all plots have been recorded with the ordinal Braun-Blanquet scale, further plots with other ordinal scales and only 15% directly in percent cover (Bruelheide et al. 2019). In subsequent analyses typically plots recorded with ordinal scales and direct percent are combined, assuming that the estimation method does not influence the results.
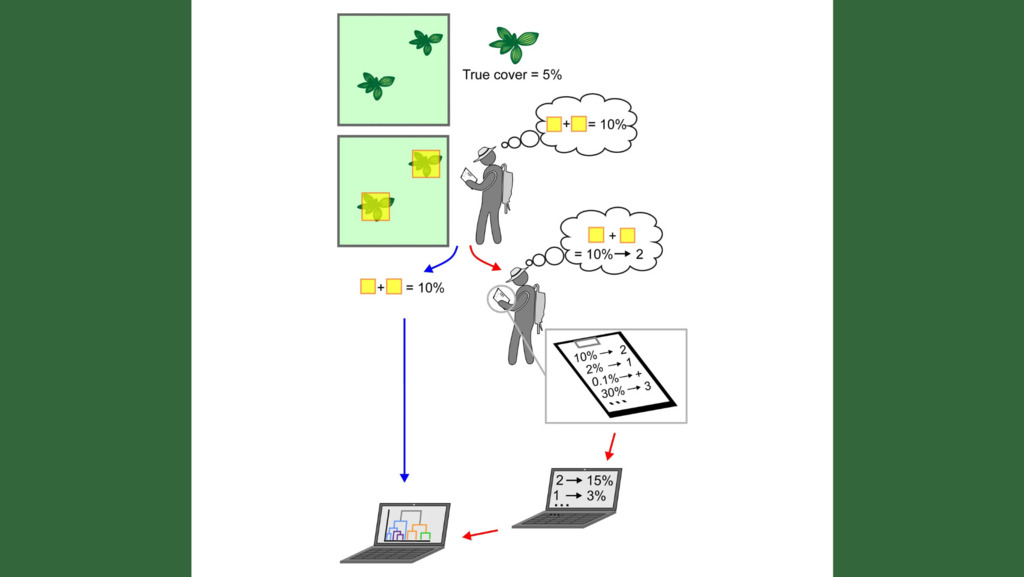
However, in a preceding simulation study we could show that using ordinal scales introduces an additional error to the cover values (Dengler & Dembicz 2023). Evidently, cover estimation of plant species in the field always comes with an error, which can be smaller or larger, dependent on the complexity of the vegetation and the experience of the surveyor. While this is the sole error in the case of cover estimation in percent, the use of ordinal scales involves two additional steps, the translation of the visual cover estimate into an ordinal code and the back-translation of this ordinal code to a cover value. Usually, this back-translation is done by using the arithmetic mid-point of the cover class borders. In this case and assuming a realistic scenario, we showed in our previous article that this leads to an “error inflation” by a factor of almost 2 (Dengler & Dembicz 2023). What we did not address in this previous paper was whether and when this “error inflation” causes biased results in subsequent analyses.
Evidently, the “error inflation” of cover values is irrelevant in any analysis that just uses the presence/absence information of species, such as species richness or mean ecological indicator values, provided they are calculated as non-weighted means as recommended recently by Ostrowski et al. (2025). The situation is different, when the cover values enter the calculations, for example, in diversity metrics other than species richness. In our new paper we thus used three different datasets which originally were assessed with percentage cover to quantify the effect of the “error inflation” in biodiversity analyses. We did this for Shannon diversity, Shannon evenness and Simpson diversity in combination with three ordinal scales, the 5-step Hult-Sernander-Du Rietz scale, the 7-step Braun-Blanquet scale and the 13-step Londo scale. Our hypothesis was that there is always a bias, but it will become smaller and smaller the finer an ordinal scale is resolved, that is, how many steps it has. In case we should find a bias, our second question was whether a different back-translation approach could possibly reduce this bias. Here we tested the geometric instead of the arithmetic midpoint of the cover class borders.
We found that the application of ordinal scales increased the calculated values of all three tested diversity metrics compared to their actual values when the conventional back-translation with the arithmetic midpoints of the class borders is used. By contrast, the replacement with the geometric midpoints led to a consistent underestimation of the three biodiversity metrics. As expected, the deviations were particularly strong for the Hult-Sernander-Du Rietz scale with only five steps. Interestingly, in the case of the arithmetic back-translation, the coarser 7-step Braun-Blanquet scale had only a minimal and partly not significant overestimation, while the more finely resolved 13-step Londo scale led to a more pronounced and always significant overestimation. This might be explained by the fact that the variant of the Braun-Blanquet scale used here had two ordinal categories for cover values < 1%, while the Londo scale does not differentiate in this range.

While this test indicated that in big and heterogenous datasets the use of ordinal scales creates a systematic bias in common biodiversity metrics, even more worrisome is our observation that within each dataset the ranking of plots according to their biodiversity can change dramatically when ordinal scales are applied. In the case of the Hult-Sernander-Du Rietz scale this misplacement of plots in a diversity sequence might be as bad as 80 positions out of 100, i.e. one of the most diverse plots might appear to be among the least diverse after the application of ordinal scales or vice versa.
Given that plots are frequently used for biodiversity analyses, we recommend for future sampling to abandon the use of ordinal scales in favour of direct percent estimations, which from our experience do not need more time in the field. For the use of legacy data, we consider it important that the big plot databases (EVA, sPlot, GrassPlot) indicate the original scale on which plant importance was measured instead of solely presenting percentage values, irrespective whether they are original or back-transformed. That way, analysts would have a chance to address the demonstrated biases. We also recommend more comprehensive simulation studies to test whether another back-translation method could do a better job than the arithmetic or geometric mid-points of the classes.
References:
- Bruelheide, H., Dengler, J., Jiménez-Alfaro, B., Purschke, O., Hennekens, S.M., Chytrý M., Pillar, V.D., Jansen, F., Kattge, J., (…) & Zverev, A. (2019) sPlot – a new tool for global vegetation analyses. Journal of Vegetation Science 30: 161–186. https://doi.org/10.1111/jvs.12710
- Dembicz, I. & Dengler, J. (2025) Should we estimate plant cover in percent or on ordinal scales? II – Diversity indices. Vegetation Classification and Survey 6: 133–140. https://doi.org/10.3897/VCS.144252
- Dengler, J. & Dembicz, I. (2023) Should we estimate plant cover in percent or on ordinal scales? Vegetation Classification and Survey 4: 131–138. https://doi.org/10.3897/VCS.98379, see also https://vegsciblog.org/2023/08/14/should-we-estimate-plant-cover-in-percent-or-on-ordinal-scales/
- Ostrowski, G., Aicher, S., Mankiewicz, A., Chusova, O., Dembicz, I., Widmer, S. & Dengler, J. (2025) Mean ecological indicator values: use EIVE but no cover-weighting. Vegetation Classification and Survey 6: 57–67. https://doi.org/10.3897/VCS.134800, see also https://vegsciblog.org/2025/04/03/mean-eiv-which-system-which-weighting/